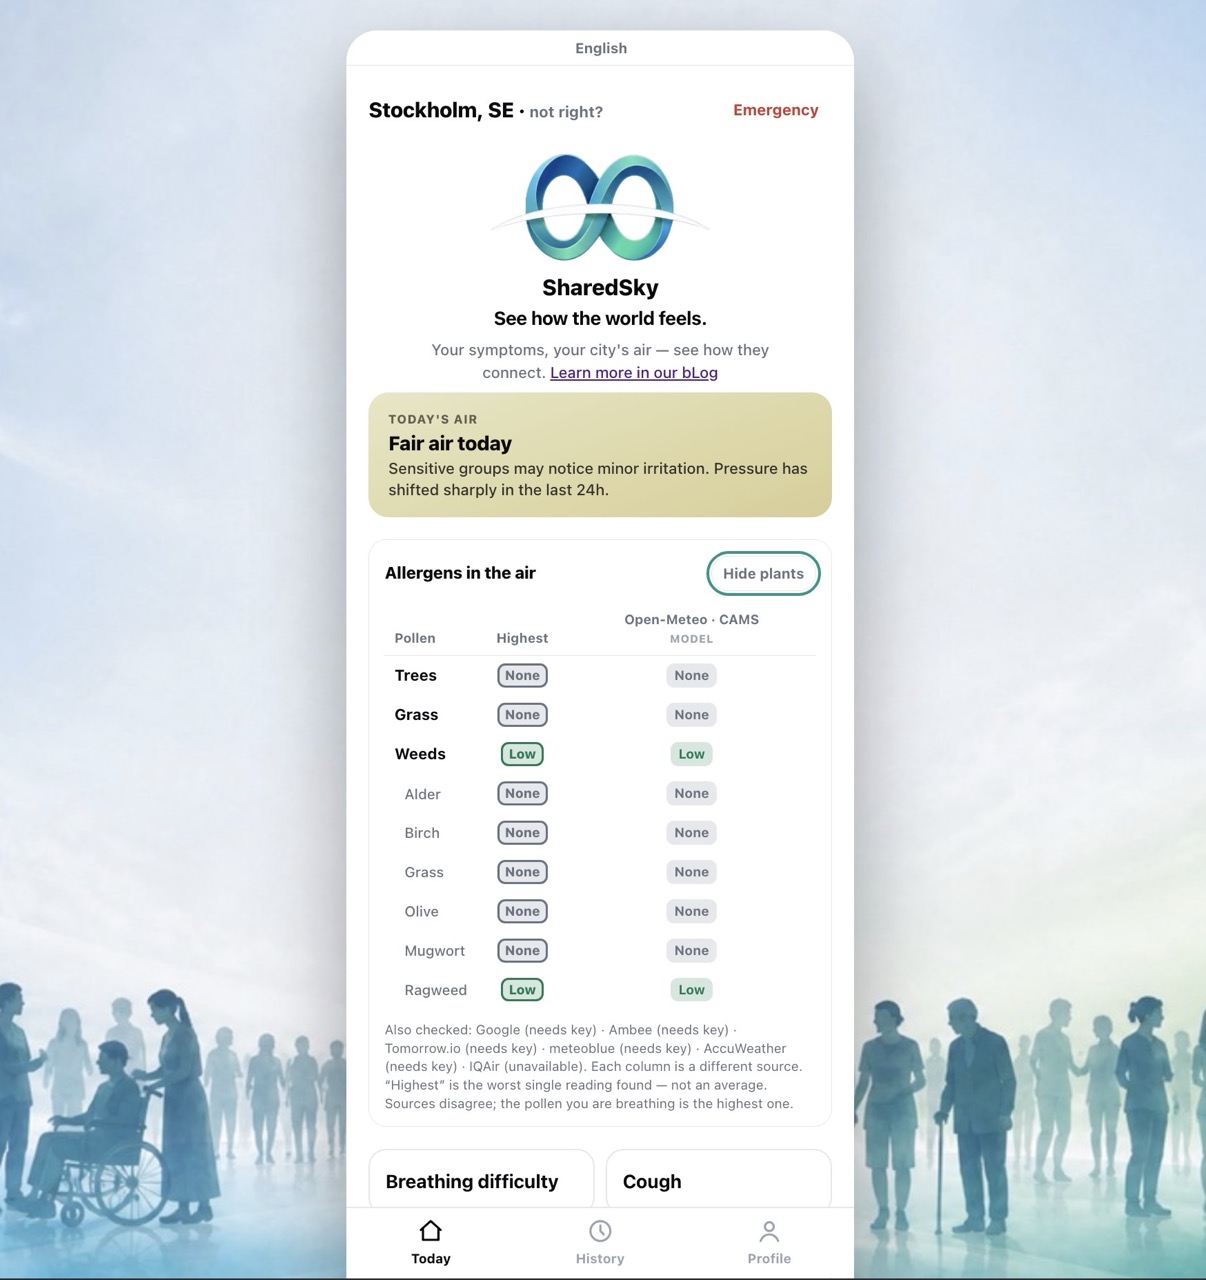
SharedSky’s new Allergens in the air feature compares pollen information from official networks, atmospheric models and other providers in one table. Because every source has gaps and blind spots, the app shows their results side by side and uses the highest reported band instead of averaging away a possible warning signal. It is a transparent view of public environmental information, including where sources disagree or return no data.
Alternative headlines:
- Why SharedSky checks more than one pollen source
- The pollen count says “low”. So why does the air feel awful?
- There is no single perfect pollen number
Your eyes itch. The air feels unpleasant. Breathing outdoors is harder than it was yesterday. You check the first pollen reading you can find and it says “low”—or even “none”.
So which should you trust: your experience or the number?
The honest answer is that a single pollen figure may not describe the air around you very well. It might come from a monitoring station far away, a forecast model covering a large grid square, or a feed that has not been updated recently. Another source may tell a completely different story.
That disagreement is the reason SharedSky’s new Allergens in the air feature does not choose one provider and present it as the final word. It compares several sources side by side underneath the main air-quality card.
The disagreement is not hidden. It is the useful part.
Official networks matter—but coverage varies
Official national pollen networks provide genuinely valuable public information. Where networks are well funded and have enough monitoring stations, they offer evidence grounded in what has actually been collected from the air.
But coverage is uneven.
A smaller country may have only a handful of stations serving its entire population. The nearest monitor might be in another city, on the other side of a mountain, or in a landscape quite unlike the one outside your window. Updates can be slow, and reports may group everything into broad categories such as trees, grass and weeds rather than identifying individual plants.
There can also be visible gaps: missing updates, unexpectedly long runs of zero, or periods when a station is not reporting.
The usual explanation is mundane—limited funding, staffing, equipment or geographic coverage—not conspiracy. Still, the practical result is the same. An official display can show little or no pollen while people nearby are plainly encountering something in the air.
That does not make official data useless. It means the data has a location, a collection method and limits.
Models fill the map, but they do not measure your street
Forecast-based services solve a different problem. Sources such as Copernicus CAMS, delivered in SharedSky through Open-Meteo, estimate pollen levels across a geographic grid. They can provide coverage where no physical station exists and can separate estimates by plant species.
This makes them an excellent baseline. SharedSky can obtain a consistent, pan-European view without depending on a local monitor being nearby or online.
But a model is still a model.
It combines factors such as vegetation, season, weather and atmospheric movement to estimate what is likely to be present. It is not a pollen trap outside your home. Local geography, wind, land use and vegetation can make one valley—or even one part of a city—different from the surrounding grid.
A model can therefore produce a precise-looking number and still be wrong locally.
Independent and commercial monitoring networks contribute another piece of the picture. They may add measured data in places where official coverage is sparse, but each network has its own instruments, calibration, reporting schedule and blind spots.
None of these sources is simply “the truth”. They observe or estimate different parts of a complicated, changing environment.
One small table instead of one false certainty
SharedSky’s approach is straightforward: show the available sources together.
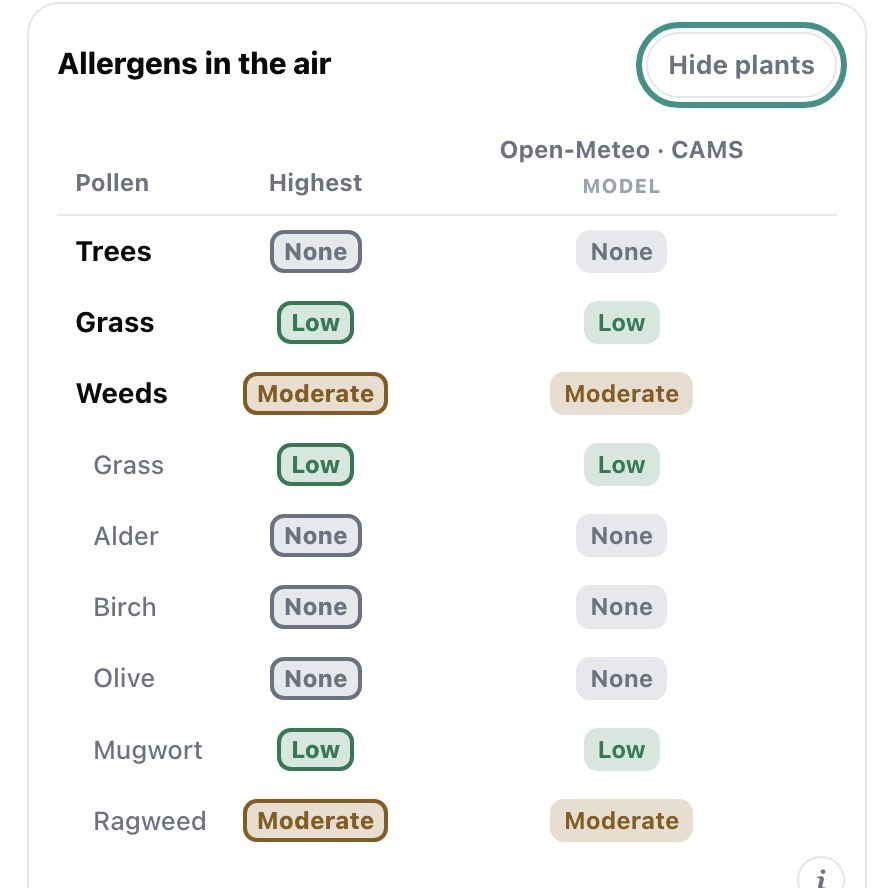
The comparison uses rows for Trees, Grass and Weeds, with a plant-by-plant breakdown when a source provides enough detail. Each provider gets its own column, so a low estimate from one source can sit beside a high reading from another. A pinned Highest column gives the cautious headline for each category.
This is a deliberate refusal to smooth away disagreement.
Many apps need one neat value for a card, so averaging might seem like the obvious choice. SharedSky does not average pollen bands across sources. It takes the maximum.
Suppose one network reports high ragweed while another reports zero. An average would pull the result towards the middle, even if the zero came from a distant station, a delayed update or an inaccurate local forecast. The calculation would make the display look more certain while weakening the strongest warning signal.
If a credible source detects a high level, that high reading represents a plausible account of the air a person may be encountering. Blending it with a possibly under-reporting feed could make useful information disappear.
Averages hide. The maximum keeps the worst credible case visible.
That choice can make SharedSky’s headline more cautious than another service’s number. It does not mean every high source is guaranteed to describe conditions on your street. It means the app will not quietly erase that source’s result for the sake of a tidier answer.
A short look under the bonnet
SharedSky connects to each provider through a small translation layer. Every source can keep its own format while the app receives a consistent result.
The source that is always available is Open-Meteo’s feed based on Copernicus CAMS. It requires no API key, covers Europe and provides estimates for individual pollen types. SharedSky also connects to Germany’s DWD official forecast and makes best-effort checks of the official Serbian SEPA and Montenegrin polen.org.me pages.
Connections for Google Pollen, Tomorrow.io, Ambee, meteoblue and AccuWeather are implemented but remain inactive until their respective API keys are supplied. IQAir is listed as a placeholder because it does not offer a public pollen endpoint.
These providers do not speak the same numerical language. One may report grains per cubic metre, another a universal index from zero to five, while DWD uses half-steps on a zero-to-three scale. Some sources publish only words describing risk.
SharedSky converts those formats to a common five-band scale:
None · Low · Moderate · High · Very high
Raw pollen counts are converted using thresholds specific to each category. This matters because the same number does not mean the same thing for every pollen type. A ragweed concentration considered very high could be unremarkable for grass. Applying one universal grains-per-cubic-metre threshold would create a simple but misleading comparison.
The sources are checked together and their results are folded into the table. If a provider fails, does not cover the selected area or requires a missing key, it is not quietly erased from the story. An information button reveals an “also checked” note showing sources that returned no usable data.
Results use the same six-hour cache as SharedSky’s other environmental conditions. The feature does not introduce an account, consent request or additional personal-data collection. It compares public environmental information, much like gathering several weather forecasts for the same place.
The gaps remain visible
A multi-source comparison does not eliminate uncertainty. It displays it more honestly.
Web-page scrapers can break when an official site changes its layout, so SharedSky reports “no data” rather than trying to guess. The mapping between a location and a German forecast region is necessarily coarse. Model estimates may miss sharply local conditions. Monitoring networks may have gaps or use different collection methods.
Even a measured value is a measurement from somewhere, during a particular period, using a particular instrument.
This is why the individual columns matter as much as the Highest result. If every source agrees, that agreement is useful. If they diverge widely, that is useful too: you know the apparently simple pollen number is uncertain.
SharedSky is not trying to turn environmental data into medical advice. The comparison can help people make ordinary decisions of the kind public authorities already discuss—such as whether to close windows or limit time outdoors on a high-pollen day—but it cannot explain an individual’s symptoms.
What it can do is stop pretending that one provider has a perfect view of the sky.
When the sources disagree, you should be allowed to see it.